
Training Update – Stats
I thought it might be interesting to show some various stats. This post is going to include a graph of the distance I have run by month over the past year and the temperature measured over my Aug 30 running workout.
Mileage Stats
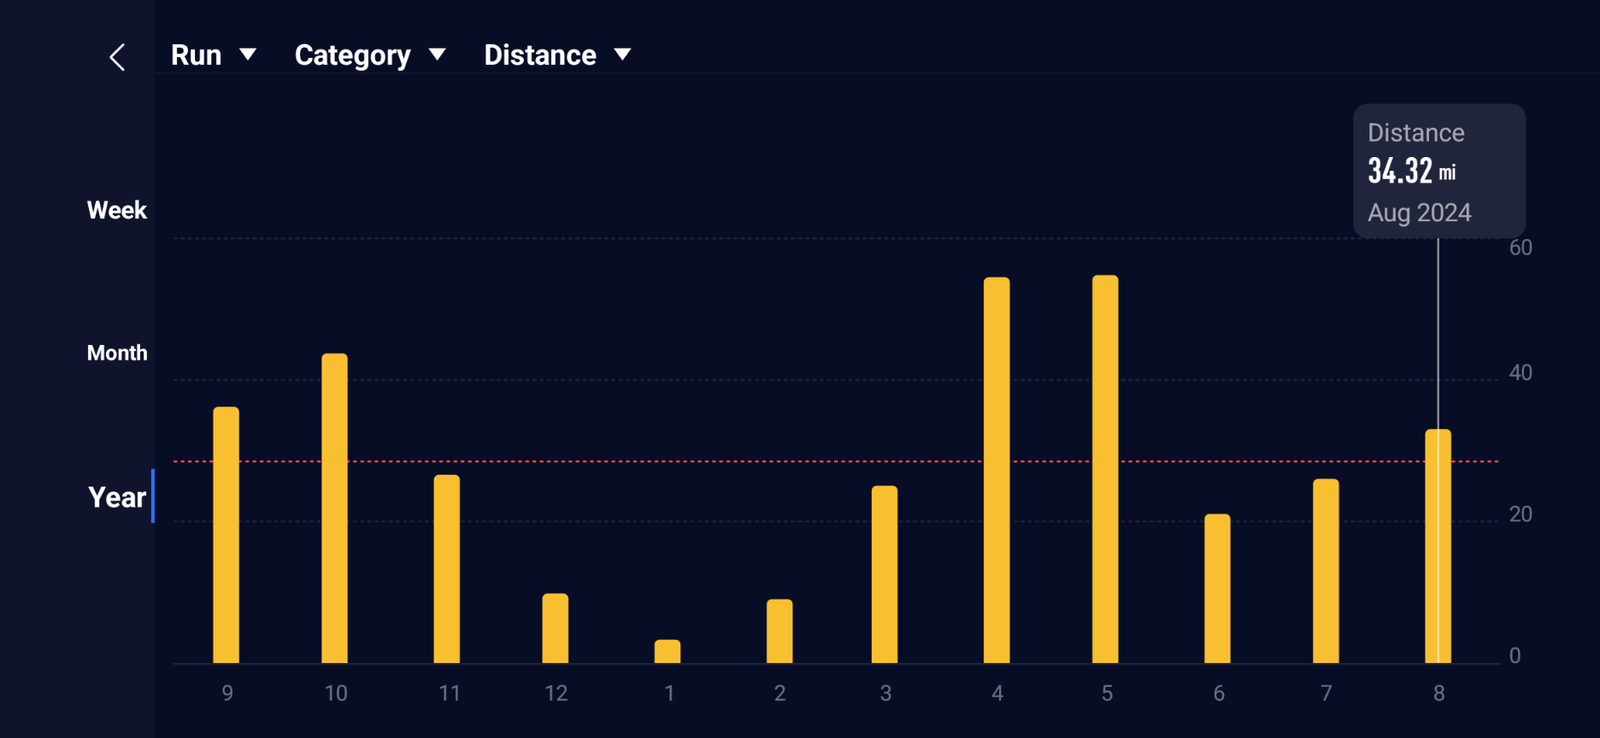
As you can see, December, January and February were quite low (the January number was 3 miles for reference). I was following a training plan from September to the beginning of December leading up to my first 5k at the end of December. A combination of rain and the training having actually ended, left me slacking in December.
January…. well after the 5k on Dec 27th, I had no goal and therefore just no ambition to get out and run. Toward the end of February, I recognized that I needed to have a goal or I would not stick with running. So I set a 10k race goal for June. It is no surprise that after the 10k at the beginning of June, the rest of June was a slacker. Again I recognized I needed a goal. So sub 30 5k was the target. Then the heat hit in July and I have tried my best to stick with training. I should have a lot more mileage racked up for July and August.
Temp Stats
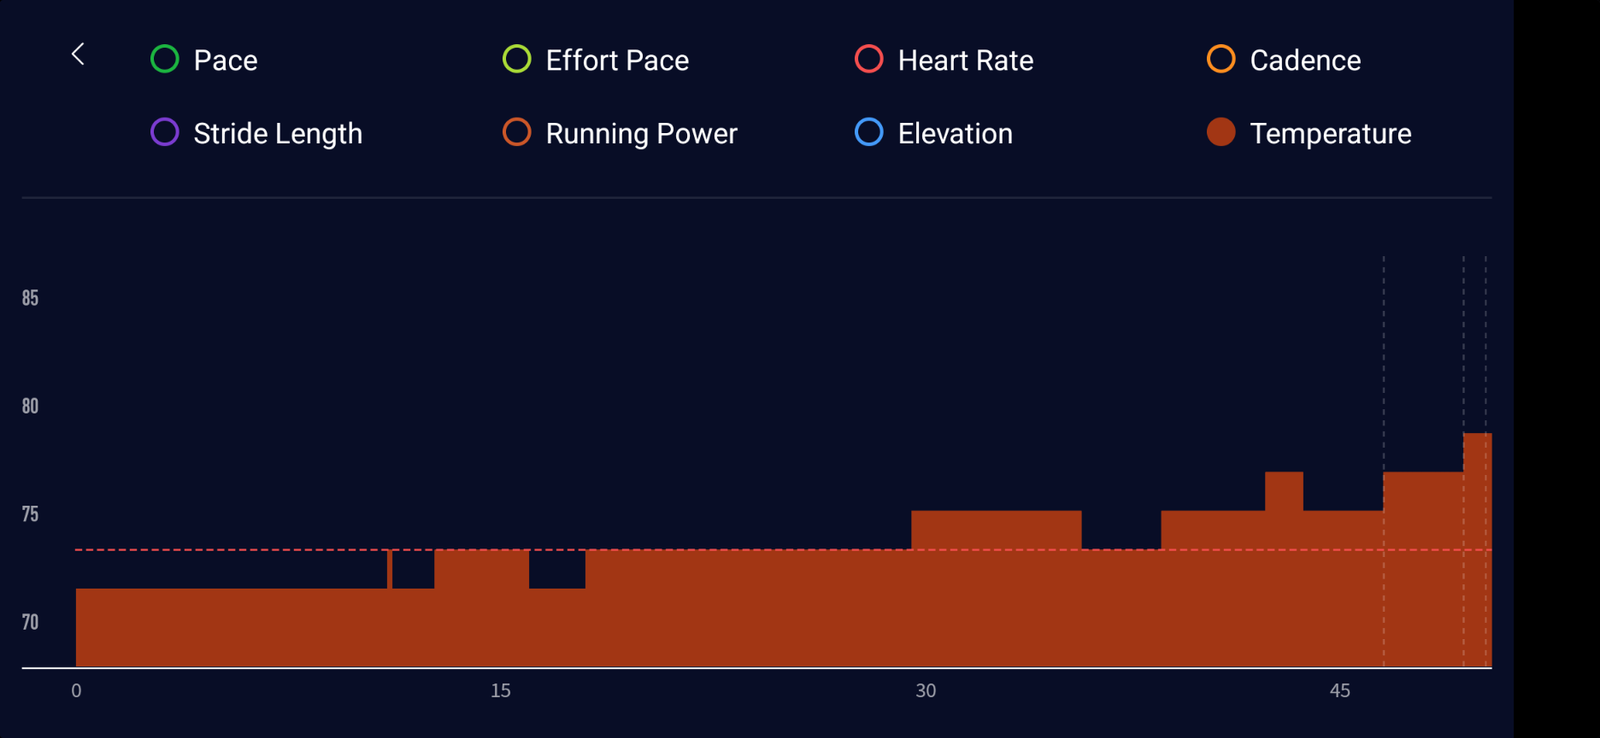
As you can see, the run started out at a nice temp of around 72 F and ended at 80 F. Unfortunately, the device I used to measure running stats like cadence, distance and temp does not capture humidity. I couldn’t find actual humidity stats for this area by time, but the avg humidity today was 81%, so quite humid.